Useful resources for Azure developers and architects! Microsoft Azure has unveiled the App Service Landing Zone Accelerator, an open-source collection of architectural guidance and reference implementation to accelerate the deployment of Azure App Service at scale. Whether you're building new applications in the cloud or looking to modernize your existing web apps, this accelerator provides a simple and robust starting point!
𝐒𝐞𝐜𝐮𝐫𝐞 𝐃𝐞𝐬𝐢𝐠𝐧 𝐏𝐫𝐢𝐧𝐜𝐢𝐩𝐥𝐞𝐬
With the App Service Landing Zone Accelerator, you can implement a range of secure design principles to protect your apps and data.
Use isolated network layers for the different components
Use protected Azure Active Directory-based access via Managed Identity
Use private endpoints for Azure services
Use Network Security Groups to control inbound and outbound traffic at the subnet level
Enable Standard DDoS Protection for the SPOKE
𝐂𝐨𝐦𝐩𝐫𝐞𝐡𝐞𝐧𝐬𝐢𝐯𝐞 𝐃𝐞𝐬𝐢𝐠𝐧 𝐀𝐫𝐞𝐚𝐬
The accelerator encompasses various design areas, covering critical aspects of your app's architecture.
An Event Aggregator acts as a single source of events for many objects. It registers for all the events of the many objects allowing clients to register with just the aggregator.
Benefits. Producers and consumers are decoupled. No point-to-point integrations. It's easy to add new consumers to the system
Here is the overall solution
How to Organize Events Flow in a Microservices Architecture
Numerous enterprise solutions based on the microservices architecture have an issue with generalizing event flow from different sources. A lot of solutions also have various providers, for example:
Azure Service Bus
Apache Kafka
RabbitMQ
Here we need a component with the ability to join event publishers and event subscribers
Another example that follows this principle is Azure Event Grid
With the Event-Grid, you can join cloud resources that produce events (publishers) and resources that handle the events (subscribers).
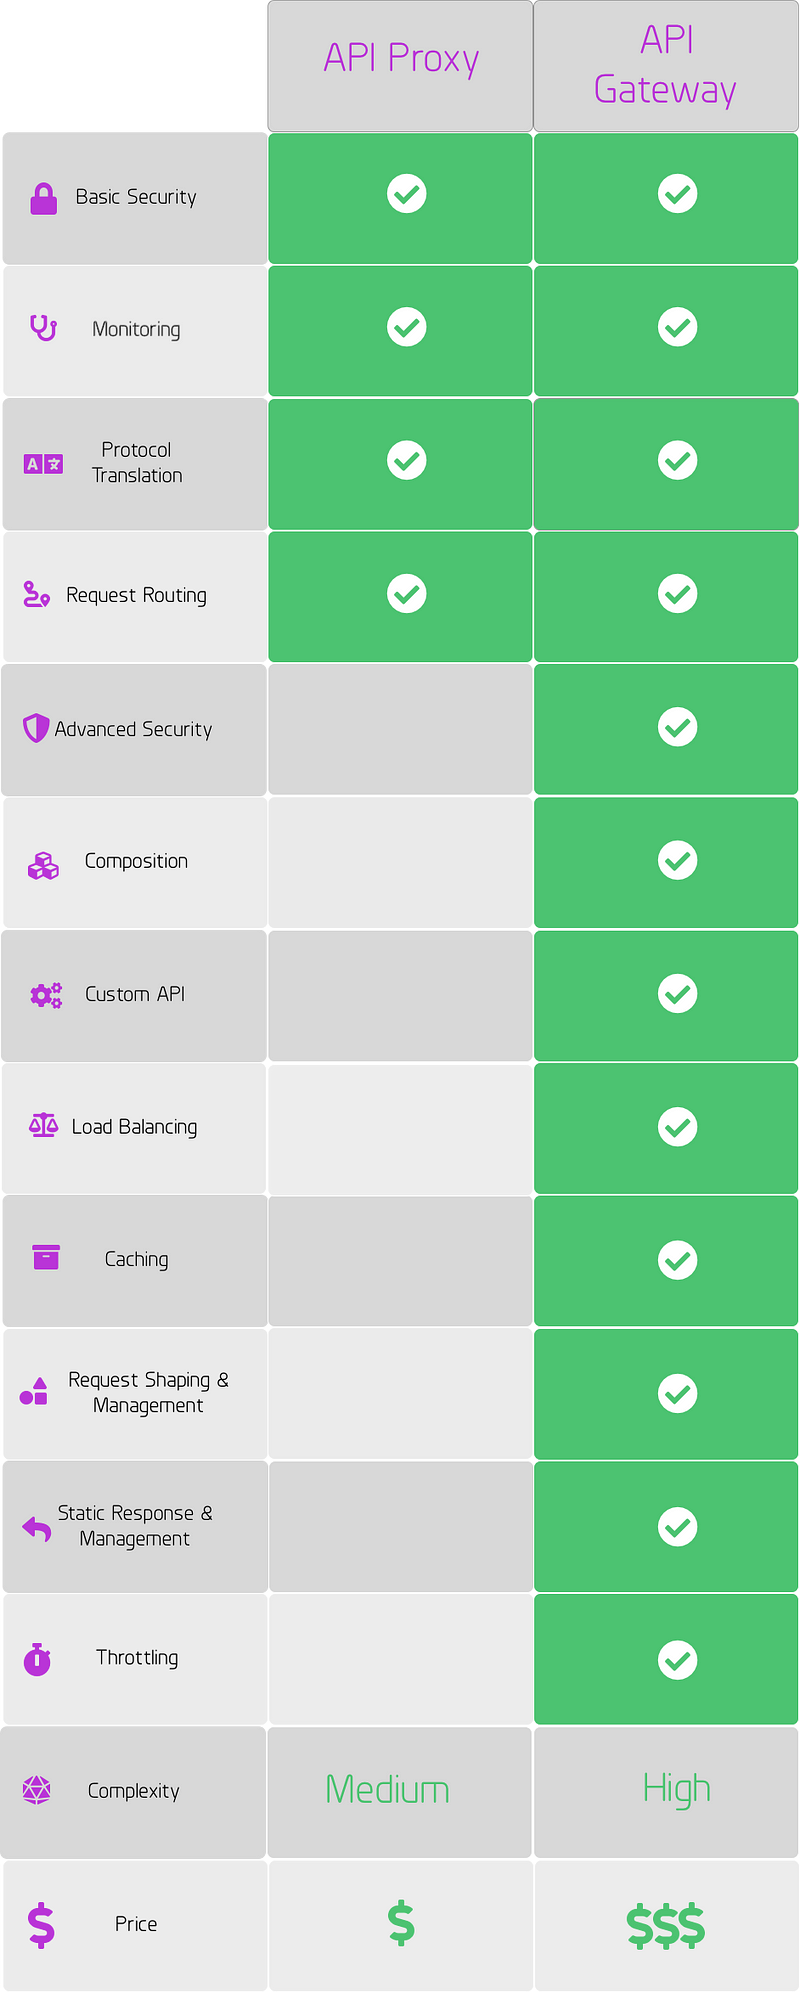
A proxy, in its most basic form, is an intermediary acting on behalf of something else. Similar to the legal concept of a proxy, an API Proxy acts on behalf of the API instead of an individual. In more technical terms, an API Proxy decouples the frontend of the API from the backend services and filters all incoming and outgoing traffic. The decoupling of front-end and back-end services allows for changes to be made to backend services without disrupting the production API. The filtering of incoming and outgoing traffic allows for monitoring, basic forms of security, request routing, and protocol translation.
Important Note
It is important to note that API Proxies require an existing API while some API Gateways can assist in building a new API.
API Gateway
API Gateways function in a similar way but have a much more robust set of features. Gateways perform the same functions as API Proxies, decoupling the frontend and backend of the API, monitoring, basic security, request routing, and protocol translation, but can also provide:
Advanced Security
Composition
Custom API
Load Balancing
Caching
Request Shaping and Management
Static Response Handling
Throttling
API Proxy versus API Gateway?
The use case for an API Proxy versus an API Gateway depends on what kinds of capabilities you require and where you are in the API Lifecycle. If you already have an existing API that doesn’t require the advanced capabilities that an API Gateway can offer than an API Proxy would be a recommended route. You can save valuable engineering bandwidth because proxies are much easier to maintain and you won’t suffer any negligible performance loss. If you need specific capabilities that a proxy doesn’t offer you could also develop an in-house layer to accommodate your use case. If you are earlier in the API lifecycle or need the extra features that an API Gateway can provide, then investing in one would pay dividends
To maintain compatibility with legacy servers, many TLS clients implement a downgrade dance: in a first handshake attempt, offer the highest protocol version supported by the client;
if this handshake fails, they retry (possibly repeatedly) with earlier protocol versions.
Unlike proper protocol version negotiation (if the client offers TLS 1.2, the server may respond with, say, TLS 1.0), this downgrade can also be triggered by network glitches, or by active attackers.
So if an attacker that controls the network between the client and the server interferes with any attempted handshake offering TLS 1.0 or later, such clients will readily confine themselves to SSL 3.0.
Encryption in SSL 3.0 uses either the RC4 stream cipher or a block cipher in CBC mode.
RC4 is well known to have biases, meaning that if the same secret (such as a password or HTTP cookie) is sent over many connections and thus encrypted with many RC4 streams, more and more information about it will leak.
Unlike with the BEAST and Lucky 13 attacks, there is no reasonable workaround.
This leaves us with no secure SSL 3.0 cipher suites at all: to achieve secure encryption, SSL 3.0 must be avoided entirely.
Disable the SSLv3 Protocol to handle POODLE attacks on Cloud Front
Similarly to Amazon ELB, Amazon AWS has taken care of the issue disabling SSLv3 for the customers who use the default SSL settings.
Nevertheless, customers who are using custom SSL certificates with Amazon Cloud Front should disable the SSLv3 protocol manually by following the steps below in the Amazon CloudFront Management Console:
Select your distribution, then click “Distribution Settings”.
Click the “Edit” button on the “General” tab.
In the “Custom SSL Client Support” section, select the option that says: “Only Clients that Support Server Name Indication (SNI)”.
Click “Yes, Edit” to save these revised settings.
Disable the SSLV3 Protocol to handle POODLE on Amazon AWS ELB
All the ELBs which are created after 10/14/2014 5:00 PM PDT will use a new SSL Negotiation Policy that will by default no longer enable SSLv3.
For the existing ELBs, it’s necessary to manually disable SSLv3 via the AWS Management console:
Select your load balancer (EC2 -> Load Balancers) in the appropriate region
In the Listeners tab, click “Change” in the Cipher column.|
Ensure that the radio button for “Predefined Security Policy” is selected, in the dropdown select the “ELBSecurityPolicy-2014-10” policy.
You can see the Protocol-SSLV3 is unchecked after selecting the policy.
Click “Save” to apply the settings to the listener
Repeat these steps for each listener that is using HTTPS or SSL for each LoadBalancer.
ADO you may want to force the pipeline builds to run against a specific agent in an agent pool.
This is possible via “Demands” in the Pipeline builds as shown below
The scenario check to run the TASK against a specific agent name
If the agent name matches from the agent pool, then the job will run else the job will switch to the next agent and then condition will be checked against that agent in that pool.
Until the condition is met the agents in the pool will be round robinly selected by the JOB
This mechanism is used to check the conditions for running a job in a pipeline during runtime
You could retrieve the list of test runs, the sort descending the result on ID, since the most recent test run has the greatest ID. Then get the first item of the result. All of this shown below in powershell:
$testingBaseUrl = "https://dev.azure.com/cbre/Research%20Engine/_apis/test/runs"
$testingUrl = $testingBaseUrl + "?api-version=5.0"
$testingUrl = $testingUrl + "-preview.2"

write-host $testingUrl


#create auth header to use for REST calls
$username = "RKesavana"
$token = "your token"  Refer to my blog of how to create Personal access tokens

#create auth header to use for REST calls
$accessToken = ("{0}:{1}" -f $username,$token)
$accessToken = [System.Text.Encoding]::UTF8.GetBytes($accessToken)
$accessToken = [System.Convert]::ToBase64String($accessToken)
$headers = @{Authorization=("Basic {0}" -f $accessToken)}


try{
# write-host "To fetch LIST all the Test ID's information"
$testRuns=Invoke-RestMethod -Uri $testingUrl -Method Get -Headers $headers
$testRunsIdSorted = $testRuns.value | sort-object id -Descending
# write-host $testRunsIdSorted

$testURLByRunID= $testingBaseUrl+"/"+$($testRunsIdSorted[0].id)
$testURLByRunID= $testURLByRunID+ "?api-version=5.0"
$testURLByRunID = $testURLByRunID + "-preview.2"

write-host "To fetch the MOST RECENT run Test RUN ID"
write-host $testURLByRunID
$mostRecentTestRun = Invoke-RestMethod -Uri  $testURLByRunID -Headers $headers -Method Get | Select-Object id,name,url,build,isAutomated,iteration,owner,project,startedDate,completedDate,state,totalTests,incompleteTests,notApplicableTests,passedTests,unanalyzedTests,revision,webAccessUrl

#PRINT the values from the  REST calls

write-host  "owner" $mostRecentTestRun.owner
write-host "startedDate" $mostRecentTestRun.startedDate
write-host "completedDate" $mostRecentTestRun.completedDate
write-host "totalTests" $mostRecentTestRun.totalTests
write-host "incompleteTests" $mostRecentTestRun.incompleteTests
write-host "notApplicableTests" $mostRecentTestRun.notApplicableTests
write-host "passedTests" $mostRecentTestRun.passedTests
write-host "unanalyzedTests" $mostRecentTestRun.unanalyzedTests
write-host "revision" $mostRecentTestRun.revision
write-host "webAccessUrl" $mostRecentTestRun.webAccessUrl


write-Host "##vso[task.setvariable variable=mostRecentRun;]$mostRecentTestRun


}  Catch  { $exception = $_.Exception
  $respstream = $exception.Response.GetResponseStream()
  $sr = new-object System.IO.StreamReader $respstream
  $ErrorResult = $sr.ReadToEnd()
  write-host $ErrorResult
}
When you write a criteria query or create a dynamic entity graph, you need to reference the entity classes and their attributes.
The quickest and easiest way is to provide the required names as Strings.
But this has several drawbacks, e.g. you have to remember or look-up all the names of the entity attributes when you write the query.
But it will also cause even greater issues at later phases of the project, if you have to refactor your entities and change the names of some attributes.
In that case you have to use the search function of your IDE and try to find all Strings that reference the changed attributes.
This is a tedious and error prone activity which will easily take up the most time of the refactoring
Use the static metamodel to write criteria queries and dynamic entity graphs.
This is a small feature defined by the JPA specification which provides a type-safe way to reference the entities and their properties.
The Metamodel Generator also takes into consideration xml configuration specified in orm.xml or mapping files specified in persistence.xml. However, if all configuration is in XML you need to add in at least on of the mapping file the following persistence unit metadata:
Maven dependency: The jar file for the annotation processor can be found as below.
org.hibernatehibernate-jpamodelgen1.0.0
Maven compiler plugin configuration - direct execution
Javac Task configuration
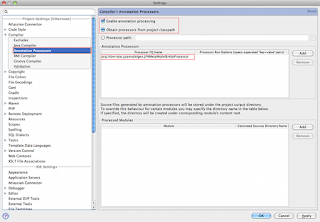
As mentioned before, the annotation processor will run automatically each time the Java compiler is called, provided the jar file is on the classpath.
IDE Configuration
A simple entity for this example.
@Entity
@Table(name="ALERT")
public class AlertEO implements java.io.Serializable{

 private static final long serialVersionUID = 1L;
 private Integer id;
 private String name;
 private String description;
 /**
  * method to get serial Id
  *
  * @return id
  */
 @Id
 @Column(name="id")
 @GeneratedValue(strategy = GenerationType.AUTO)
 public Integer getId() {
  return id;
 }

 /**
  * Functions to get id
  * @return id
  */
 public void setId(Integer id){
  this.id = id;
 }

 /**
  * Functions to get name
  * @return name
  */
 @Column(name = "name")
 public String getName(){
  return name;
 }

 /**
  * Functions to set name
  * @return name
  */
 public void setName(String name){
  this.name = name;
 }

 /**
  * Functions to get description
  * @return description
  */
 @Column(name = "description")
 public String getDescription(){
  return description;
 }

 /**
  * Functions to set description
  * @return description
  */
 public void setDescription(String description){
  this.description=description;
 }
  /* (non-Javadoc)
  * @see java.lang.Object#toString()
  */
 @Override
 public String toString() {
  return "AlertEO [id=" + id + ", name=" + name + ", description=" + description + "]";
 }
The class of the static metamodel looks similar to the entity.
Based on the JPA specification, there is a corresponding metamodel class for every managed class in the persistence unit.
You can find it in the same package and it has the same name as the corresponding managed class with an added ‘_’ at the end
@Generated(value = "org.hibernate.jpamodelgen.JPAMetaModelEntityProcessor")
@StaticMetamodel(AlertEO.class)
public abstract class AlertEO_{
 public static volatile SingularAttribute<AlertEO, String>firstName;
 public static volatile SingularAttribute<AlertEO, String> lastName;
 public static volatile SetAttribute<AlertEO, Book> books;
 public static volatile SingularAttribute<AlertEO, Long> id;
 public static volatile SingularAttribute<AlertEO, Integer> version;
}
Using metamodel classes
You can use the metamodel classes in the same way as you use the String reference to the entities and attributes.
The APIs for criteria queries and dynamic entity graphs provide overloaded methods that accept Strings and implementations of the Attribute interface.
CriteriaBuilder cb = this.em.getCriteriaBuilder();
// create the query
CriteriaQuey<AlertEO> q = cb.createQuery(AlertEO.class);
// set the root class
Root<AlertEO> a = q.from(AlertEO.class);
// use metadata class to define the where clause
q.where(cb.like(a.get(AlertEO_.name), "J%"));
// perform query
this.em.createQuery(q).getResultList();
For more information on Kibana here is a nice article
 KIBANA SEARCH
Step 1- Install Elasticsearch
Download elasticsearch zip file from https://www.elastic.co/downloads/elasticsearch
Extract it to a directory (unzip it)
Run it (bin/elasticsearch or bin/elasticsearch.bat on Windows)
Check that it runs using curl -XGET http://localhost:9200
Here's how to do it (steps are written for OS X but should be similar on other systems):
wget https://download.elastic.co/elasticsearch/elasticsearch/elasticsearch-1.7.1.zip
unzip elasticsearch-1.7.1.zip
cd elasticsearch-1.7.1
bin/elasticsearch
Elasticsearch should be running now. You can verify it's running using curl. In a separate terminal window execute a GET request to Elasticsearch's status page:
curl -XGET http://localhost:9200
If all is well, you should get the following result:
Download Kibana archive from https://www.elastic.co/downloads/kibana
Please note that you need to download appropriate distribution for your OS, URL given in examples below is for OS X
Extract the archive
Run it (bin/kibana)
Check that it runs by pointing the browser to the Kibana's WebUI
wget https://download.elastic.co/kibana/kibana/kibana-4.1.1-darwin-x64.tar.gz
tar xvzf kibana-4.1.1-darwin-x64.tar.gz
cd kibana-4.1.1-darwin-x64
bin/kibana
Point your browser to http://localhost:5601 (if Kibana page shows up, we're good - we'll configure it later)
Step 3) Install Logstash
Download Logstash zip from https://www.elastic.co/downloads/logstash
In order to have Logstash ship log files to Elasticsearch, we must first configure Spring Boot to store log entries into a file.
We will establish the following pipeline: Spring Boot App --> Log File --> Logstash --> Elasticsearch.
There are other ways of accomplishing the same thing, such as configuring logback to use TCP appender to send logs to a remote Logstash instance via TCP, and many other configurations.
Anyhow, let's configure Spring Boot's log file.
The simplest way to do this is to configure log file name in application.properties.
It's enough to add the following line:
logging.file=application.log
Spring Boot will now log ERROR, WARN and INFO level messages in the application.log log file and will also rotate it as it reaches 10 Mb.
Step 5) Configure Logstash to Understand Spring Boot's Log File Format
Typical Logstash config file consists of three main sections: input, filter and output.
Each section contains plugins that do relevant part of the processing
such as file input plugin that reads log events from a file or elasticsearch output plugin which sends log events to Elasticsearch.
Input section defines from where Logstash will read input data
in our case it will be a file hence we will use a file plugin with multiline codec, which basically means that our input file may have multiple lines per log entry.
type is set to java - it's just additional piece of metadata in case you will use multiple types of log files in the future.
path is the absolute path to the log file. It must be absolute - Logstash is picky about this.
We're using multiline codec which means that multiple lines may correspond to a single log event,
In order to detect lines that should logically be grouped with a previous line we use a detection pattern:
pattern => "^%{YEAR}-%{MONTHNUM}-%{MONTHDAY} %{TIME}.*" ? Each new log event needs to start with date.
negate => "true" ? if it doesn't start with a date ...
what => "previous" ? ... then it should be grouped with a previous line.
File input plugin, as configured, will tail the log file (e.g. only read new entries at the end of the file). Therefore, when testing, in order for Logstash to read something you will need to generate new log entries.
Filter Section
Filter section contains plugins that perform intermediary processing on an a log event.
In our case, event will either be a single log line or multiline log event grouped according to the rules described above.
In the filter section we will do several things:
Tag a log event if it contains a stacktrace. This will be useful when searching for exceptions later on.
Parse out (or grok, in logstash terminology) timestamp, log level, pid, thread, class name (logger actually) and log message.
Specified timestamp field and format - Kibana will use that later for time based searches.
Filter section for Spring Boot's log format that aforementioned things looks like this:
filter {
  #If log line contains tab character followed by 'at' then we will tag that entry as stacktrace
  if [message] =~ "\tat" {
    grok {
      match => ["message", "^(\tat)"]
      add_tag => ["stacktrace"]
    }
  }

  #Grokking Spring Boot's default log format
  grok {
    match => [ "message",
               "(?%{YEAR}-%{MONTHNUM}-%{MONTHDAY} %{TIME})  %{LOGLEVEL:level} %{NUMBER:pid} --- \[(?[A-Za-z0-9-]+)\] [A-Za-z0-9.]*\.(?[A-Za-z0-9#_]+)\s*:\s+(?.*)",
               "message",
               "(?%{YEAR}-%{MONTHNUM}-%{MONTHDAY} %{TIME})  %{LOGLEVEL:level} %{NUMBER:pid} --- .+? :\s+(?.*)"
             ]
  }

  #Parsing out timestamps which are in timestamp field thanks to previous grok section
  date {
    match => [ "timestamp" , "yyyy-MM-dd HH:mm:ss.SSS" ]
  }
}
Explanation:
if [message] =~ "\tat" ? If message contains tab character followed by at (this is ruby syntax) then...
se the grok plugin to tag stacktraces:
match => ["message", "^(\tat)"] ? when message matches beginning of the line followed by tab followed by at then..
add_tag => ["stacktrace"] ? ... tag the event with stacktrace tag.
Use the grok plugin for regular Spring Boot log message parsing:
First pattern extracts timestamp, level, pid, thread, class name (this is actually logger name) and the log message.
Unfortunately, some log messages don't have logger name that resembles a class name (for example, Tomcat logs) hence the second pattern that will skip the logger/class field and parse out timestamp, level, pid, thread and the log message.
Use date plugin to parse and set the event date:
match => [ "timestamp" , "yyyy-MM-dd HH:mm:ss.SSS" ] ? timestamp field (grokked earlier) contains the timestamp in the specified format
Output Section
Output section contains output plugins that send event data to a particular destination.
Outputs are the final stage in the event pipeline.
We will be sending our log events to stdout (console output, for debugging) and to Elasticsearch.
Compared to filter section, output section is rather straightforward:
output {
  # Print each event to stdout, useful for debugging. Should be commented out in production.
  # Enabling 'rubydebug' codec on the stdout output will make logstash
  # pretty-print the entire event as something similar to a JSON representation.
  stdout {
    codec => rubydebug
  }

  # Sending properly parsed log events to elasticsearch
  elasticsearch {
   hosts => ["127.0.0.1"]  #  takes an array of hosts (e.g. elasticsearch cluster) as value.
  }
}
Putting it all together
Finally, the three parts - input, filter and output - need to be copy pasted together and saved into logstash.conf config file.
Once the config file is in place and Elasticsearch is running, we can run Logstash:
/path/to/logstash/bin/logstash -f logstash.conf
If everything went well, Logstash is now shipping log events to Elasticsearch.
Step 6) Configure Kibana
Ok, now it's time to visit the Kibana web UI again.
We have started it in step 2 and it should be running at http://localhost:5601.
First, you need to point Kibana to Elasticsearch index(s) of your choice.
Logstash creates indices with the name pattern of logstash-YYYY.MM.DD.
In Kibana Settings --> Indices configure the indices:
Index contains time-based events (select this option)
Use event times to create index names (select this option)
Index pattern interval: Daily
Index name or pattern: [logstash-]YYYY.MM.DD
Click on "Create Index"
Now click on "Discover" tab.
It is the places for "Search" because it allows you to perform new searches and also to save/manage them.
Log events should be showing up now in the main window.
If they're not, then double check the time period filter in to right corner of the screen.
Default table will have 2 columns by default: Time and _source.
In order to make the listing more useful, we can configure the displayed columns.
From the menu on the left select level, class and logmessage.
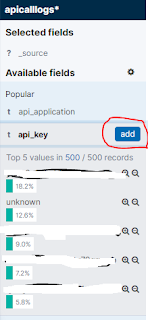
Here is a sample output screent shot of the kibana console